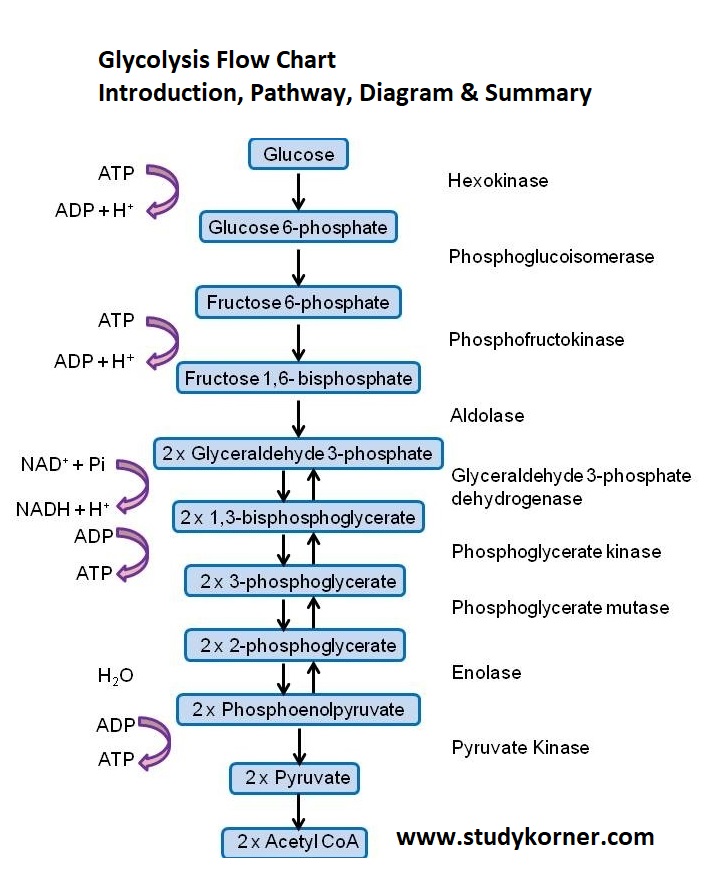
Glycolysis Flow Chart Introduction Pathway Diagram & Summary
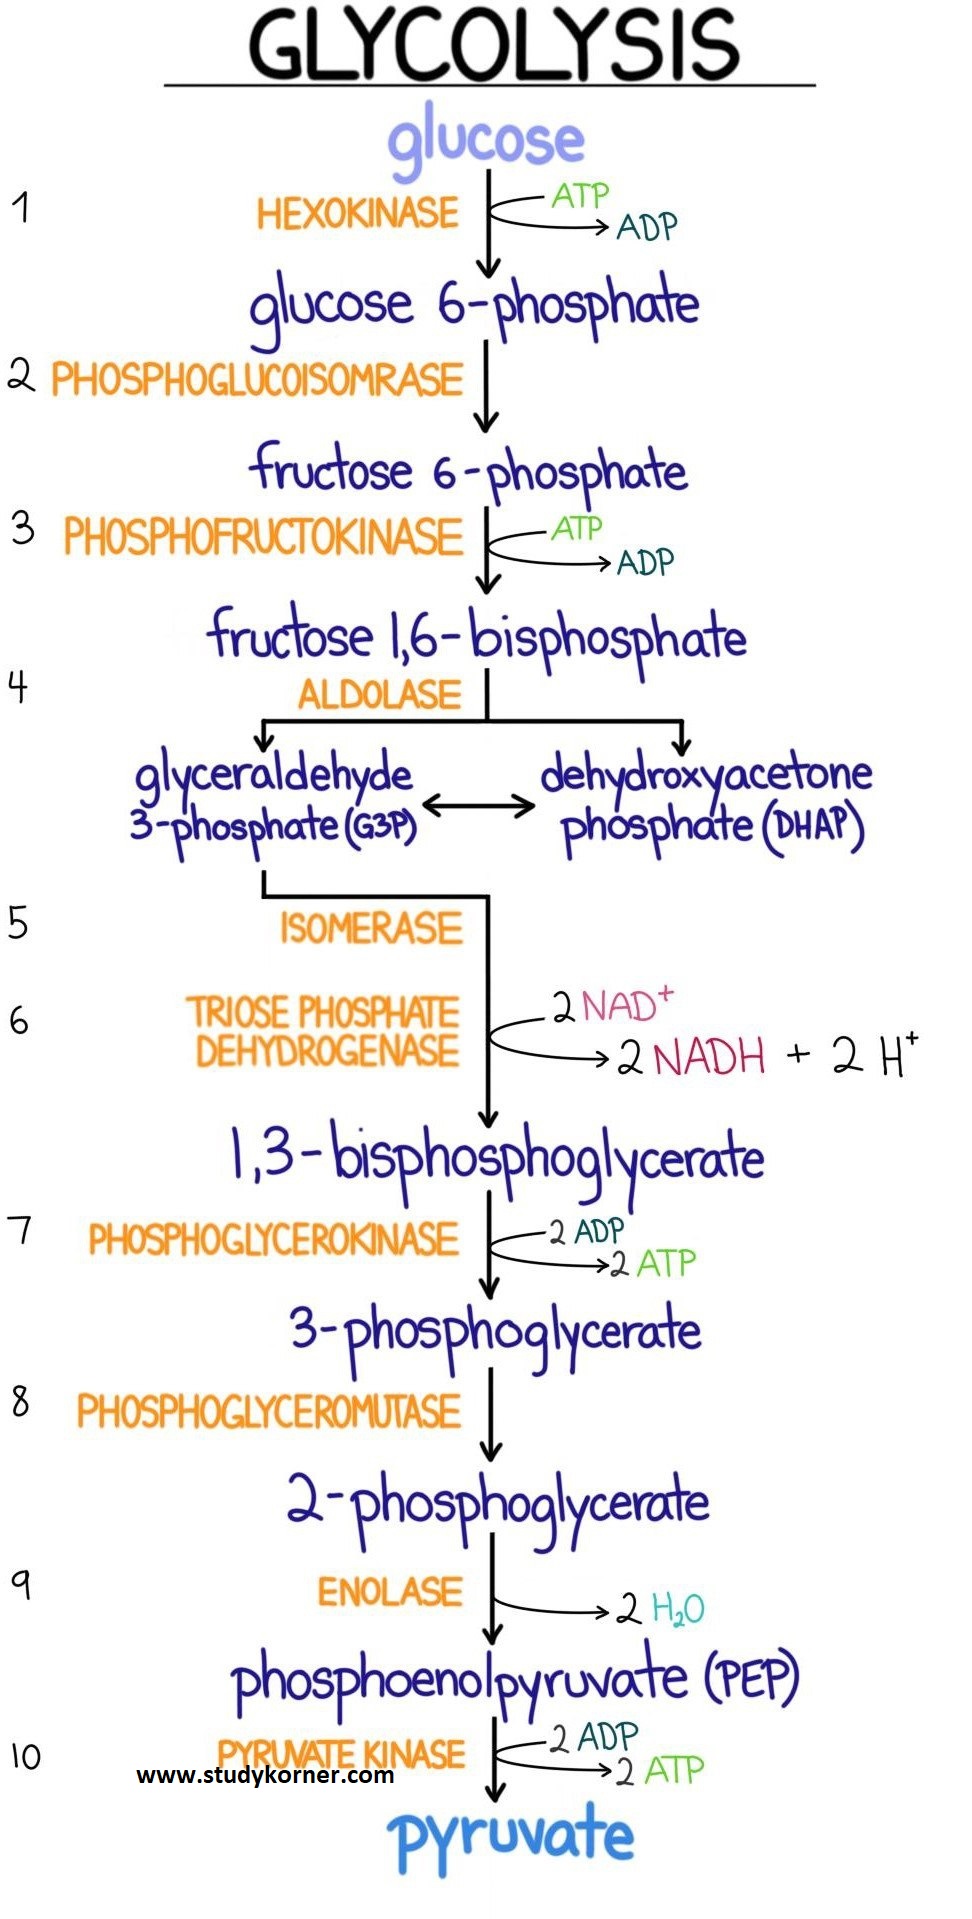
Glycolysis is a process in which glucose divided into two pyruvate molecules. However, it is assumed as a linear pathway of ten enzyme meditation steps.
Glycolysis Explained in 10 Easy Steps
Step 1: Hexokinase
Step 2: Phosphoglucose Isomerase
Step 3: Phosphofructokinase
Step 4: Aldolase
Step 5: Triosephosphate isomerase
Step 6: Glyceraldehyde-3-phosphate Dehydrogenase
Step 7: Phosphoglycerate Kinase
Step 8: Phosphoglycerate Mutase
Step 9: Enolase
Step 10: Pyruvate Kinase
Lindsey Y says
What did you use to make the first graphic?