• Skip to main content
  • Skip to secondary menu
  • Skip to primary sidebar
  • Colleges
  • Courses
  • Admissions
  • Results
  • Scholarships
  • Jobs
  • ARDMS QBank
  • NCLEX-RN Qbank

StudyPK

  • Disclaimer
  • Copyright
  • Contact us
  • About
  • Privacy
Home » Organic Chemistry » Glycolysis Flow Chart Introduction Pathway Diagram & Summary

Glycolysis Flow Chart Introduction Pathway Diagram & Summary

April 25, 2021 By Rana Waqar 1 Comment

Glycolysis Flow Chart Introduction Pathway Diagram & Summary

Glycolysis is a process in which glucose divided into two pyruvate molecules. However, it is assumed as a linear pathway of ten enzyme meditation steps.

Glycolysis Explained in 10 Easy Steps
Step 1: Hexokinase
Step 2: Phosphoglucose Isomerase
Step 3: Phosphofructokinase
Step 4: Aldolase
Step 5: Triosephosphate isomerase
Step 6: Glyceraldehyde-3-phosphate Dehydrogenase
Step 7: Phosphoglycerate Kinase
Step 8: Phosphoglycerate Mutase
Step 9: Enolase
Step 10: Pyruvate Kinase
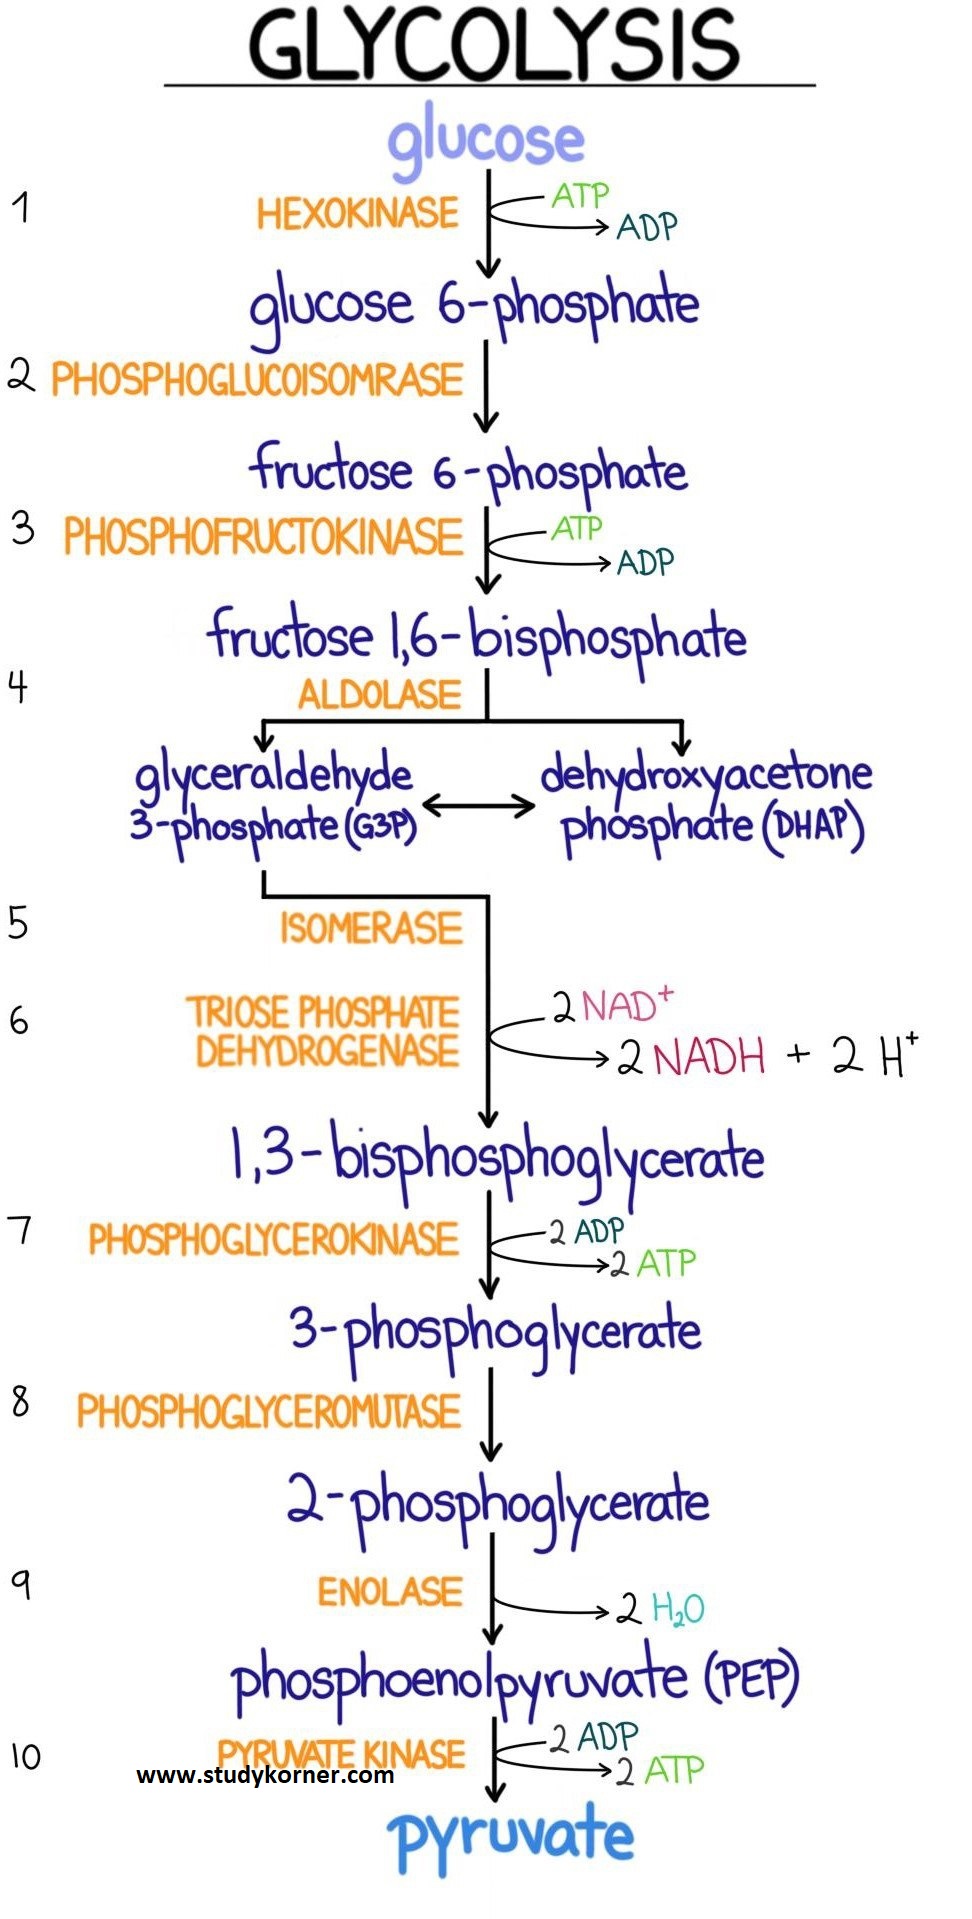
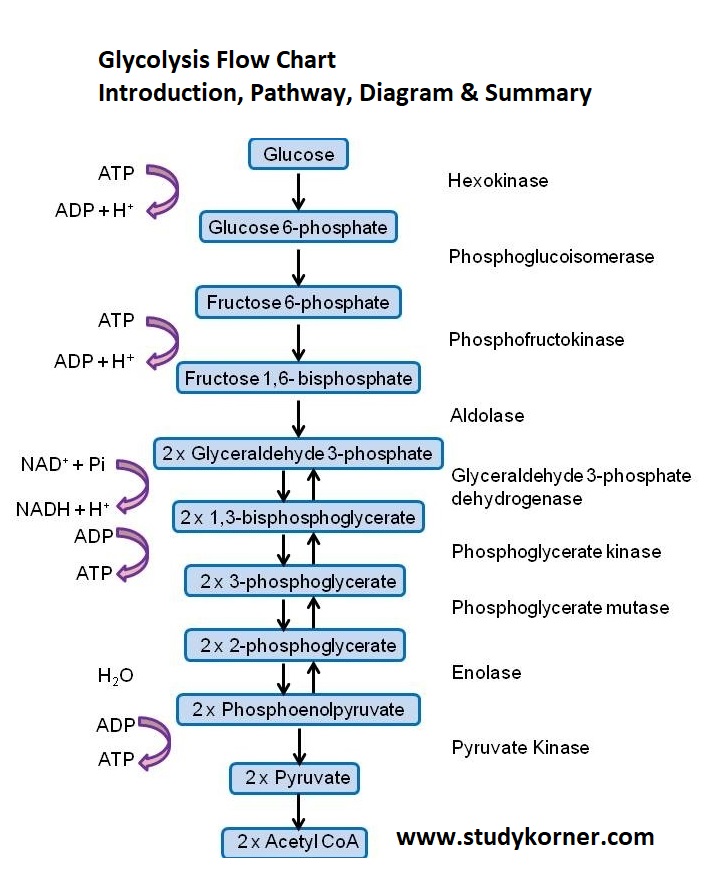
Glycolysis Flow Chart

Glycolysis Flow Chart Introduction Pathway Diagram & Summary

Filed Under: Organic Chemistry

Reader Interactions

Comments

  1. Lindsey Y says

    February 17, 2025 at 6:41 pm

    What did you use to make the first graphic?

    Reply

Leave a Reply Cancel reply

Your email address will not be published. Required fields are marked *

Primary Sidebar

Search

Copyright © 2025 · Magazine Pro on Genesis Framework · WordPress · Log in