
Animal Care and Service Workers – Salary & Career Outlook (2025 Update) Animal care and service workers play a vital role in ensuring the health, safety, and well-being of pets and animals in shelters, zoos, veterinary clinics, and pet grooming facilities. Whether walking dogs, feeding animals, or assisting with rehabilitation and grooming, these professionals are essential to … [Read more...] about Top Paying States for Animal Care and Service Workers 2025
Top Paying States for Machinists 2025
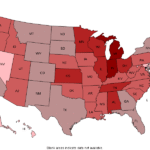
Machinist Salary and Career Outlook (2025 Update) As of May 2025, the average annual pay for Machinists is approximately $57,700, or $27.74 per hour, according to the U.S. Bureau of Labor Statistics (BLS). Salaries vary widely by state, with employers in high-demand areas offering above-average wages to attract skilled workers. Top 15 Highest Paying States for … [Read more...] about Top Paying States for Machinists 2025
Top Paying States for Correctional Officers – 2025

Top Highest Paying States for Correctional Officers and Jailers (2025 Update) Correctional officers and jailers remain essential to the criminal justice system, ensuring safety and security in prisons and jails. According to the latest U.S. Bureau of Labor Statistics (BLS) data (May 2025), the average annual wage for correctional officers and jailers has increased to … [Read more...] about Top Paying States for Correctional Officers – 2025
Step-by-Step ABG Interpretation Guide: Smarter Than ROME and Tic-Tac-Toe
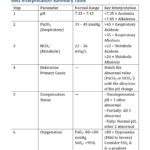
A Smarter Way to Interpret ABGs: Better Than ROME or Tic-Tac-Toe! If you’re a healthcare student or professional trying to make sense of Arterial Blood Gases (ABGs), you’ve probably heard of shortcuts like ROME (Respiratory Opposite, Metabolic Equal) or the tic-tac-toe method. But let’s be honest—those tricks often fall short when things get more complex. This ABG … [Read more...] about Step-by-Step ABG Interpretation Guide: Smarter Than ROME and Tic-Tac-Toe
NEDUET Admissions 2025: Engineering, Science & Architecture
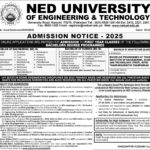
Apply Now: NED University Bachelor's Programmes 2025 Are you ready to take the next big step in your academic journey? NED University of Engineering & Technology, a leading institution renowned for its excellence in engineering, technology, and architecture, is now accepting applications for its Bachelor's degree programmes for the academic year 2025! Whether you're … [Read more...] about NEDUET Admissions 2025: Engineering, Science & Architecture